



Broker Check

Quarter Ending October 31, 2026

Published first week of each month: A deeper dive into economic trends, investment strategies, and what it all means for your financial plan.

The Rest of the Market Takes Center Stage

The month was highlighted by a sell-off in the technology names that had been driving recent index rallies. However, the broad market performed much better than headline index returns indicated. A flight to quality led to U.S. Treasury yields turning sharply lower and bonds providing some ballast to portfolios.

Monthly Quick Hits

Beyond the Headlines

The Rest of the Market Takes Center Stage

Fixed Income Update

Yields Drop as Bonds Provide Portfolio Ballast

Geopolitical and Economic Update

Growth Accelerates Despite Headwinds

Looking Ahead

Broad Improvement in Fundamentals Should Offset Risks


Beyond the Headlines:

The Rest of the Market Takes Center Stage

Despite the sell-off in technology stocks, which dragged the Nasdaq down more than 5 percent, market breadth was quite strong, with the market environment best being described as a rotation rather than risk-off. The Dow Jones Industrial Average closed up almost 2 percent, and the small-cap Russell 2000 rose as well. Perhaps more impressively, the equal weight S&P 500, which removes the impact of a company’s size, rallied 5 percent even though the market-cap weighted index declined by almost 1 percent.

In a reversal of September, only the communication services and technology sectors declined in October, by more than 15 percent and 6 percent, respectively. But that left the other nine sectors all with positive returns. With oil prices rising by more than 15 percent in the month, it was no surprise the energy sector led the way, up 14 percent. Other double-digit returns were seen in consumer staples and utilities, and health care was up just shy of 10 percent.

On the positive side, earnings season is well underway and has remained strong. Sixty percent of S&P 500 companies have now reported earnings, and expectations for growth is tracking at just over 30 percent. This would make it the second consecutive quarter of 30 percent-plus growth.

This quarter is also the first one since the fourth quarter of 2022 where, if expectations hold, the Magnificent Seven stocks will not grow earnings as fast as the remaining 493 names. Analysts now expect that when all seven big names have reported, growth for those companies will be at a respectable 22 percent. However, the other 493 companies have seen expectations rise during the month. Analysts now expect those companies to grow earnings by more than 32 percent.

5.28%

In the month of October Nasdaq Composite

0.87%

In the month of October S&P 500

arrow up  1.76%

In the month of October Dow Jones Industrial Average

Fixed Income Update:

Yields Drop as Bonds Provide Portfolio Ballast

After hitting a 25-year high of more than 5.3 percent, the 10-year Treasury bond yield declined 35 basis points and closed the month back below 5 percent. Although October reports showed inflation accelerating and oil prices continuing to march higher, investors looked to the Treasury market for safety. This led to fixed income holdings providing their historic diversification role within a portfolio. The Bloomberg U.S. Aggregate Bond Index rallied more than 2.4 percent. Strong returns were seen across the fixed income market, including a rally of more than 3.5 percent in municipal bonds.

arrow up  2.44%

In the month of October Bloomberg Aggregate Bond Index

arrow up  0.30%

In the month of October Bloomberg U.S Corporate High Yield Index

Geopolitical and Economic Update:

Growth Accelerates Despite Headwinds

The highlight of the month’s economic data was a particularly strong third-quarter gross domestic product (GDP) report. It showed U.S. economic growth had accelerated to 3.4 percent annualized growth after growing at 2.4 percent over the first six months of the year. Growth was driven in large part by business investment, particularly around AI infrastructure. But positive contributions were also seen from a resilient consumer and the government.
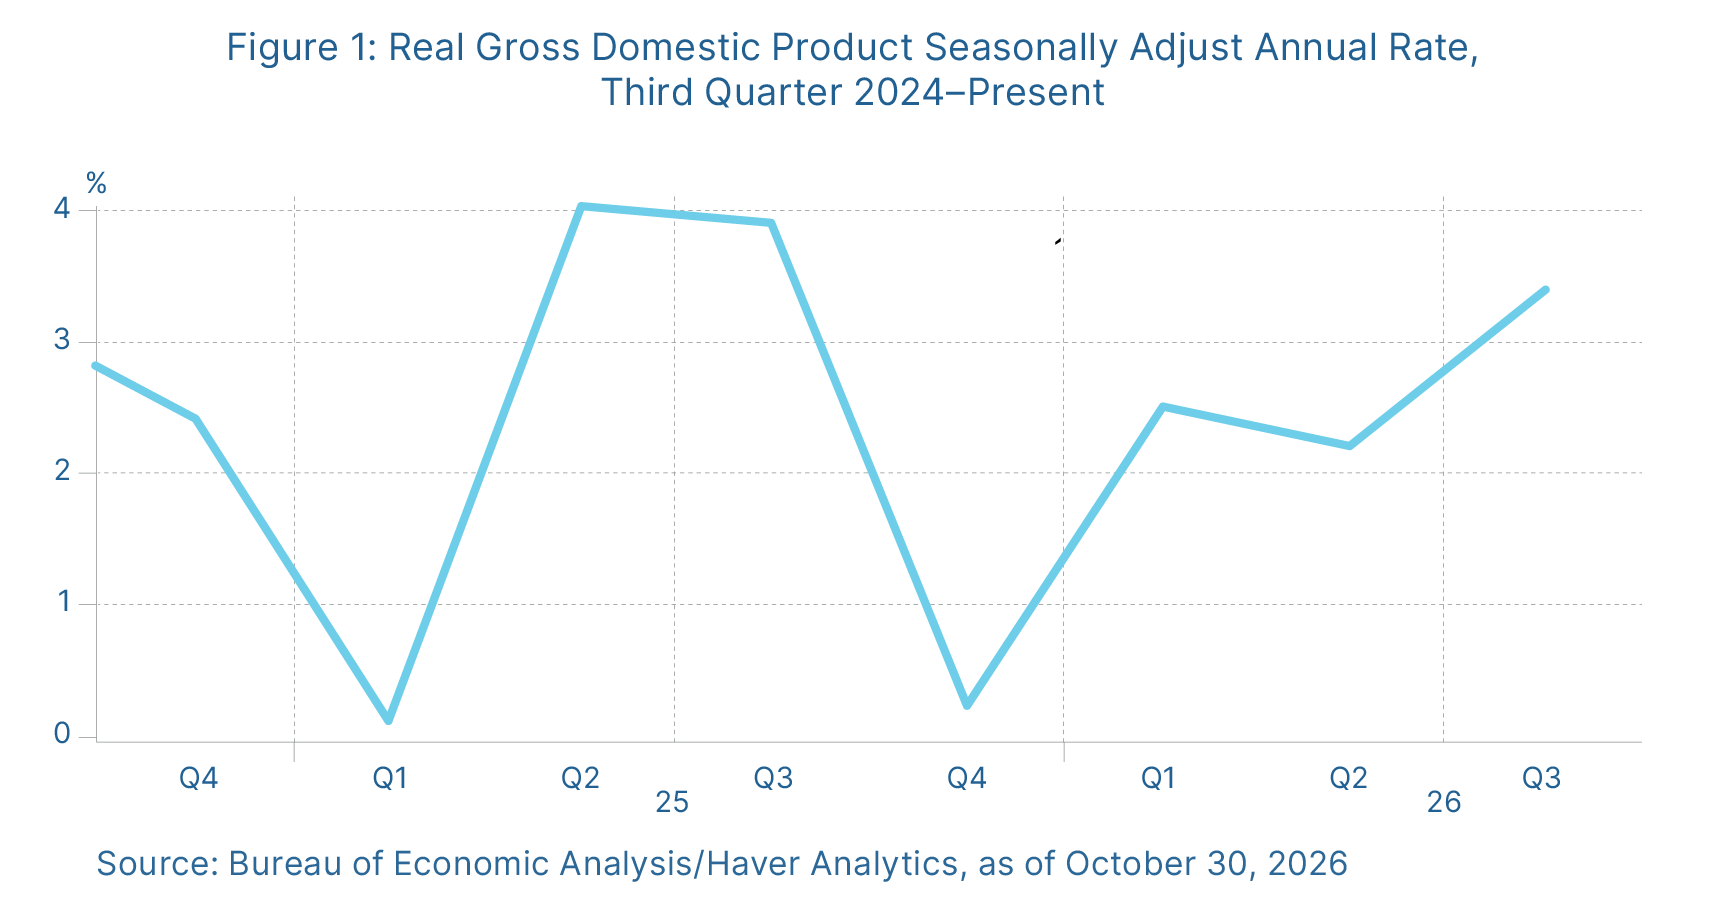
Graph

On the other hand, the September employment report came in weaker than expected with only 29,000 jobs created. In addition, the July and August reports were revised lower. At the same time, both consumer and producer price inflation moved higher due to tariffs and higher oil prices. There were also signs that pricing pressures were beginning to spread to other areas such as core goods.

The Federal Reserve took all of this into consideration and decided to leave short-term interest rates unchanged at the end of the month. However, the vote was not unanimous this time, with two dissenters wanting to raise rates now. Chair Kevin Warsh’s comments in his post-meeting press conference remained consistent with those from previous meetings. He mentioned the Fed will remain data dependent and will focus on returning inflation growth back to the Fed’s 2 percent target, a level not seen in more than five years.

The Takeaway


  • The U.S. economy accelerated in the third quarter, showing broad strength.
  • The Fed held interest rates steady in October, but the possibility of an increase in December remains strong.


Looking Ahead:

Broad Improvement in Fundamentals Should Offset Risks

Risks still exist for investors, and most of them are the same ones that have been in the headlines throughout the year. The Middle East and an escalation in military action or, conversely, progress toward a settlement will impact oil prices and inflation. The Fed is likely to raise rates before the year ends, and Election Day could result in a change in the balance of power in Washington. All of this could impact short-term movements in the market. But a strong economy and strong earnings growth that is being driven by a wide swath of companies is a positive backdrop. Ultimately, we believe this should be supportive for further market appreciation over the long term. If concerns remain, however, speak to your financial advisor to go over your financial plans.

Disclosure: This material is intended for informational/educational purposes only and should not be construed as investment advice, a solicitation, or a recommendation to buy or sell any security or investment product. Please contact your financial professional for more information specific to your situation.

Certain sections of this commentary contain forward-looking statements based on our reasonable expectations, estimates, projections, and assumptions. Forward-looking statements are not guarantees of future performance and involve certain risks and uncertainties, which are difficult to predict. Past performance is not indicative of future results. Diversification does not assure a profit or protect against loss in declining markets. All indices are unmanaged and investors cannot invest directly into an index. The Dow Jones Industrial Average is a price-weighted average of 30 actively traded blue-chip stocks. The S&P 500 Index is a broad-based measurement of changes in stock market conditions based on the average performance of 500 widely held common stocks. The Nasdaq Composite Index measures the performance of all issues listed in the Nasdaq Stock Market, except for rights, warrants, units, and convertible debentures. The MSCI EAFE Index is a float-adjusted market capitalization index designed to measure developed market equity performance, excluding the U.S. and Canada. The MSCI Emerging Markets Index is a market capitalization-weighted index composed of companies representative of the market structure of 26 emerging market countries in Europe, Latin America, and the Pacific Basin. It excludes closed markets and those shares in otherwise free markets that are not purchasable by foreigners. The Bloomberg Aggregate Bond Index is an unmanaged market value-weighted index representing securities that are SEC-registered, taxable, and dollar-denominated. It covers the U.S. investment-grade fixed-rate bond market, with index components for a combination of the Bloomberg government and corporate securities, mortgage-backed pass-through securities, and asset-backed securities. The Bloomberg U.S. Corporate High Yield Index covers the USD-denominated, non-investment-grade, fixed-rate, taxable corporate bond market. Securities are classified as high-yield if the middle rating of Moody’s, Fitch, and S&P is Ba1/BB+/BB+ or below. One basis point (bp) is equal to 1/100th of 1 percent, or 0.01 percent. 


Authored by Chris Fasciano, vice president, chief market strategist, at Commonwealth Financial Network®.

© 2026 Commonwealth Financial Network®


Let’s Talk About Your Financial Future

Whether you’re navigating a volatile market or preparing for the future, we’re here to help.

Schedule a Consultation